Begin the journey
Information Hub
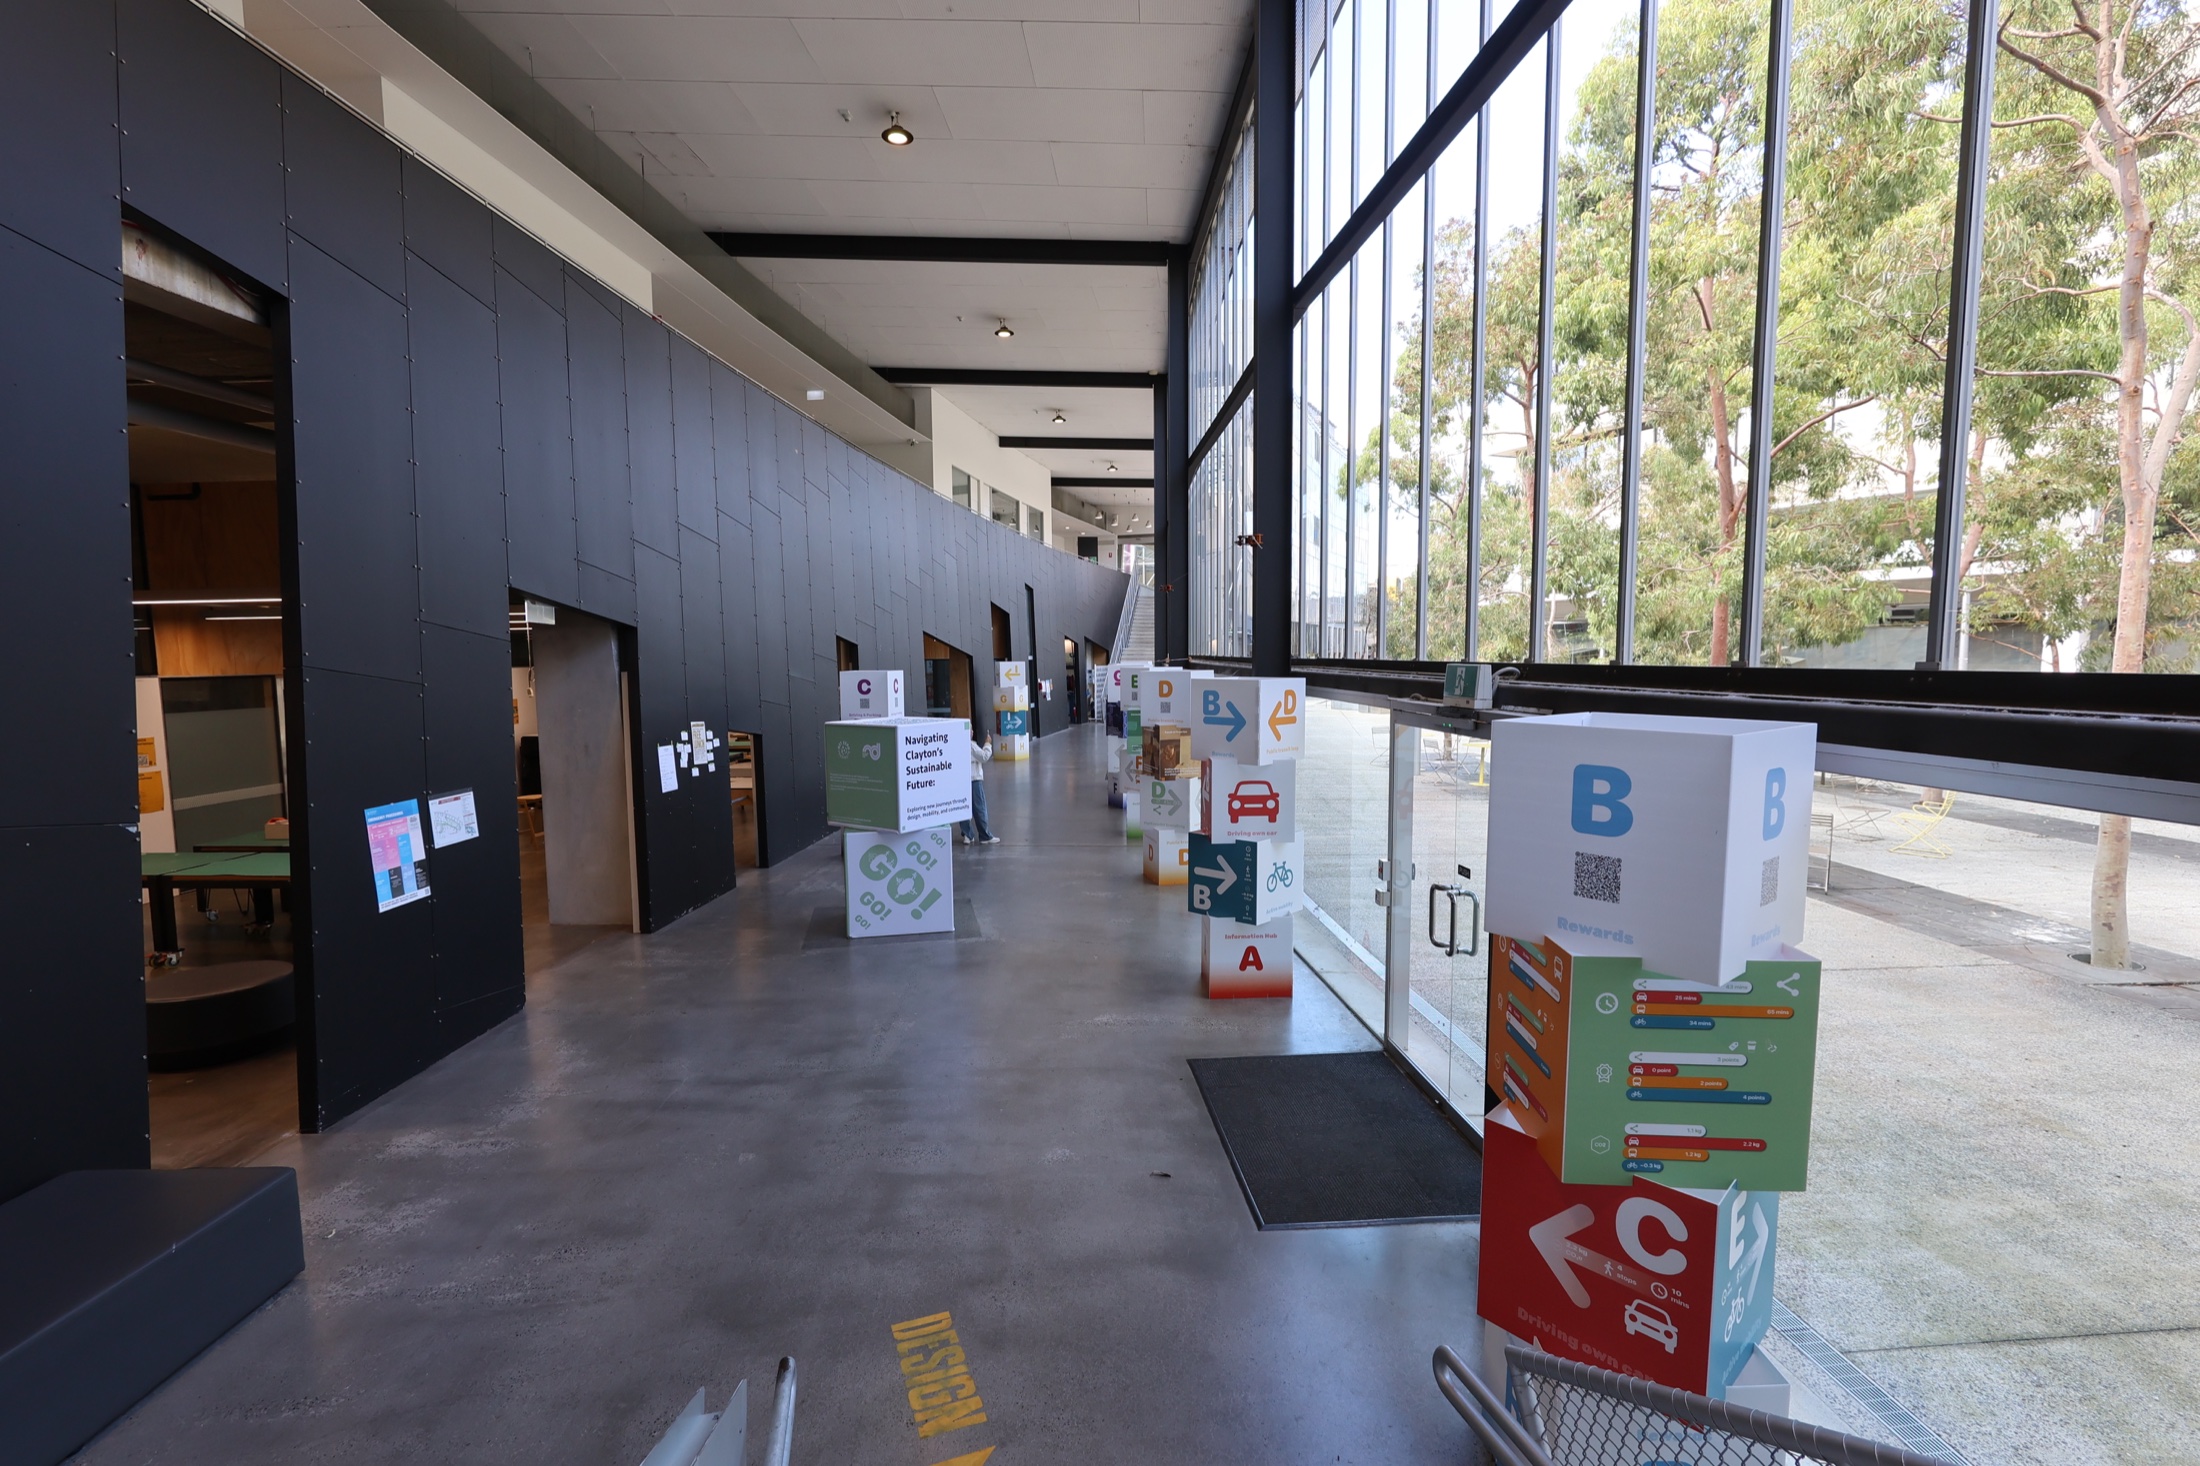
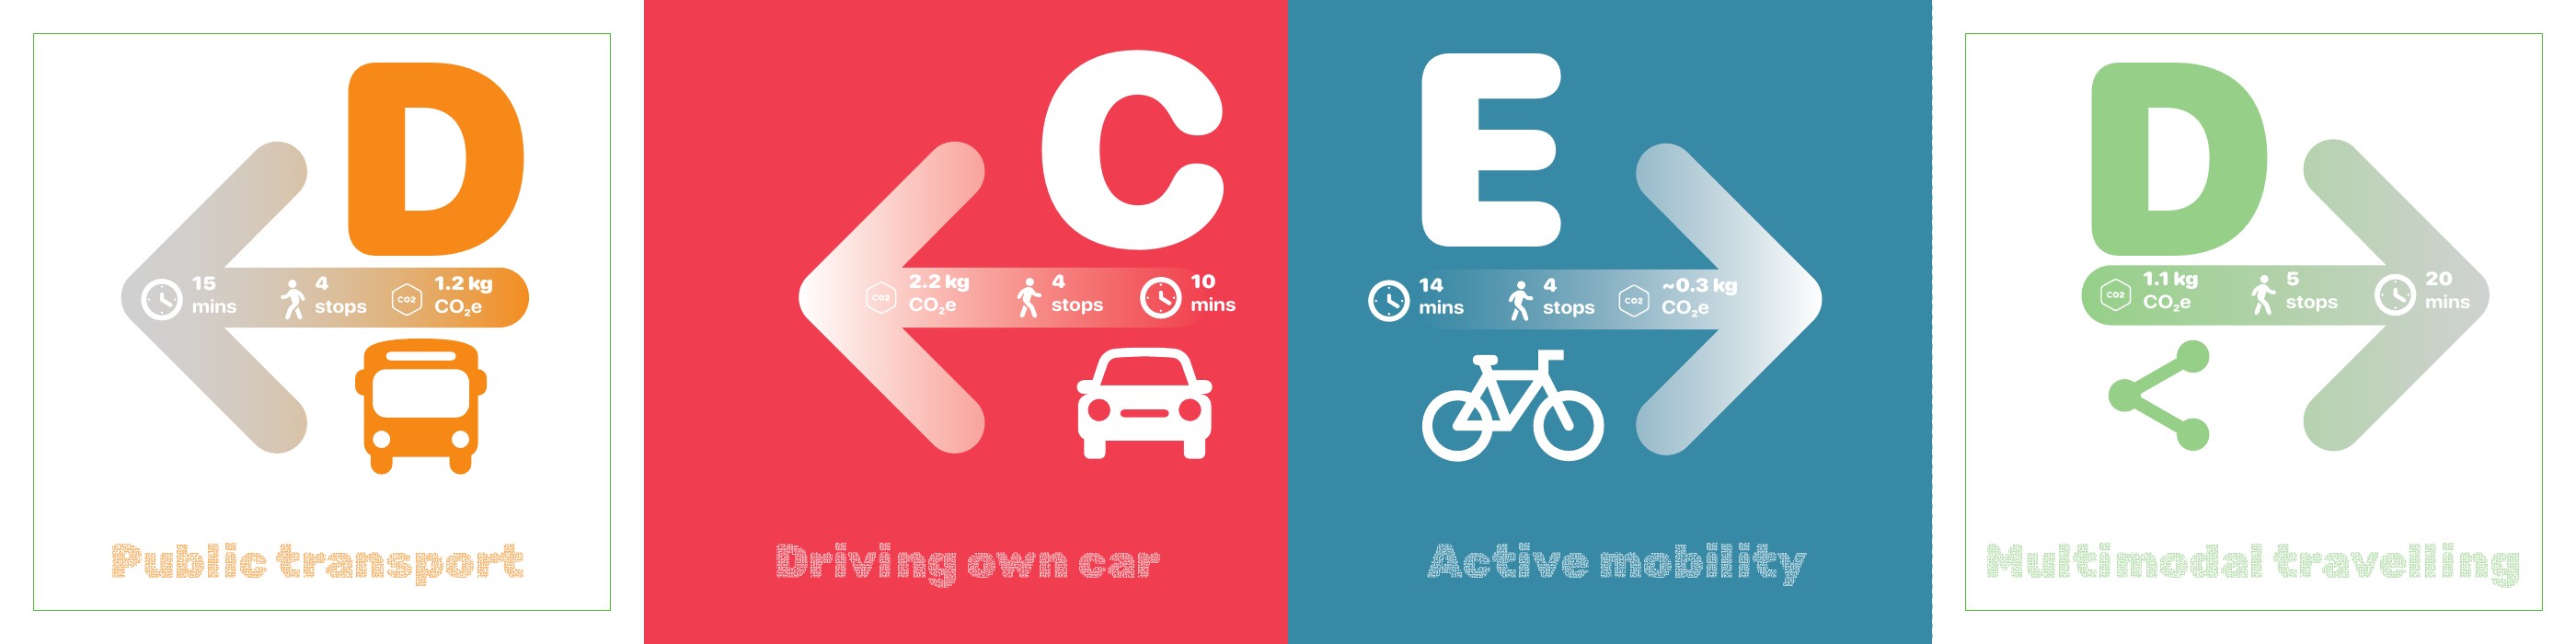
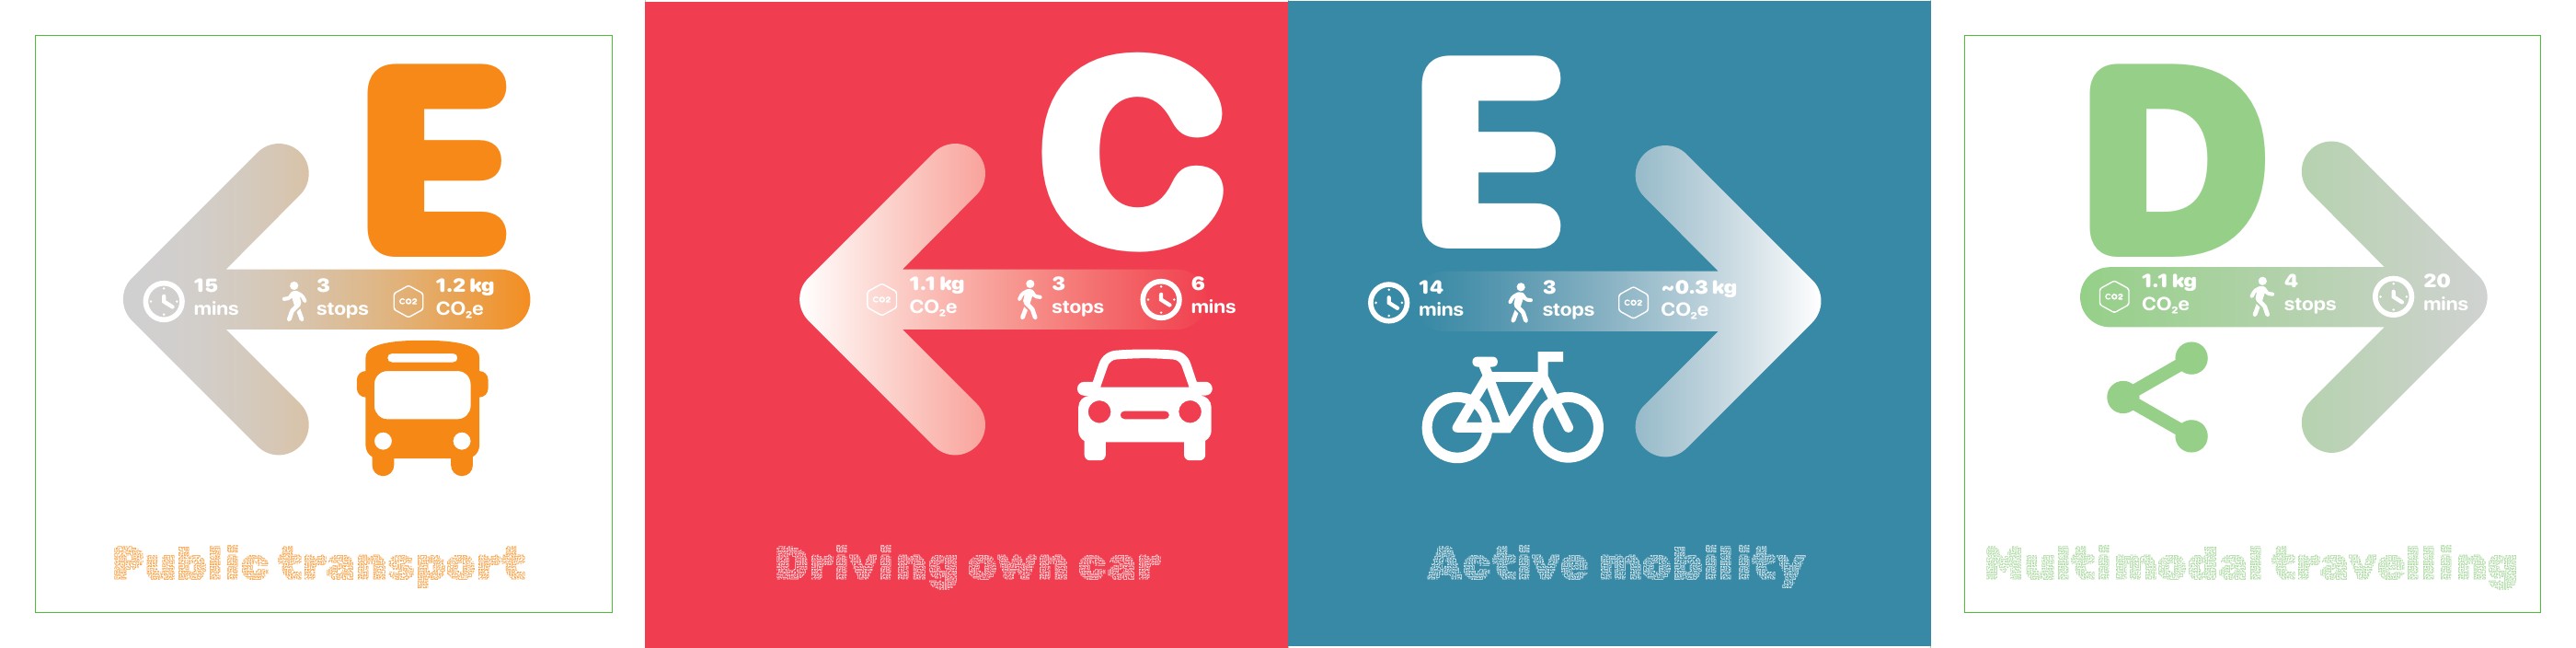
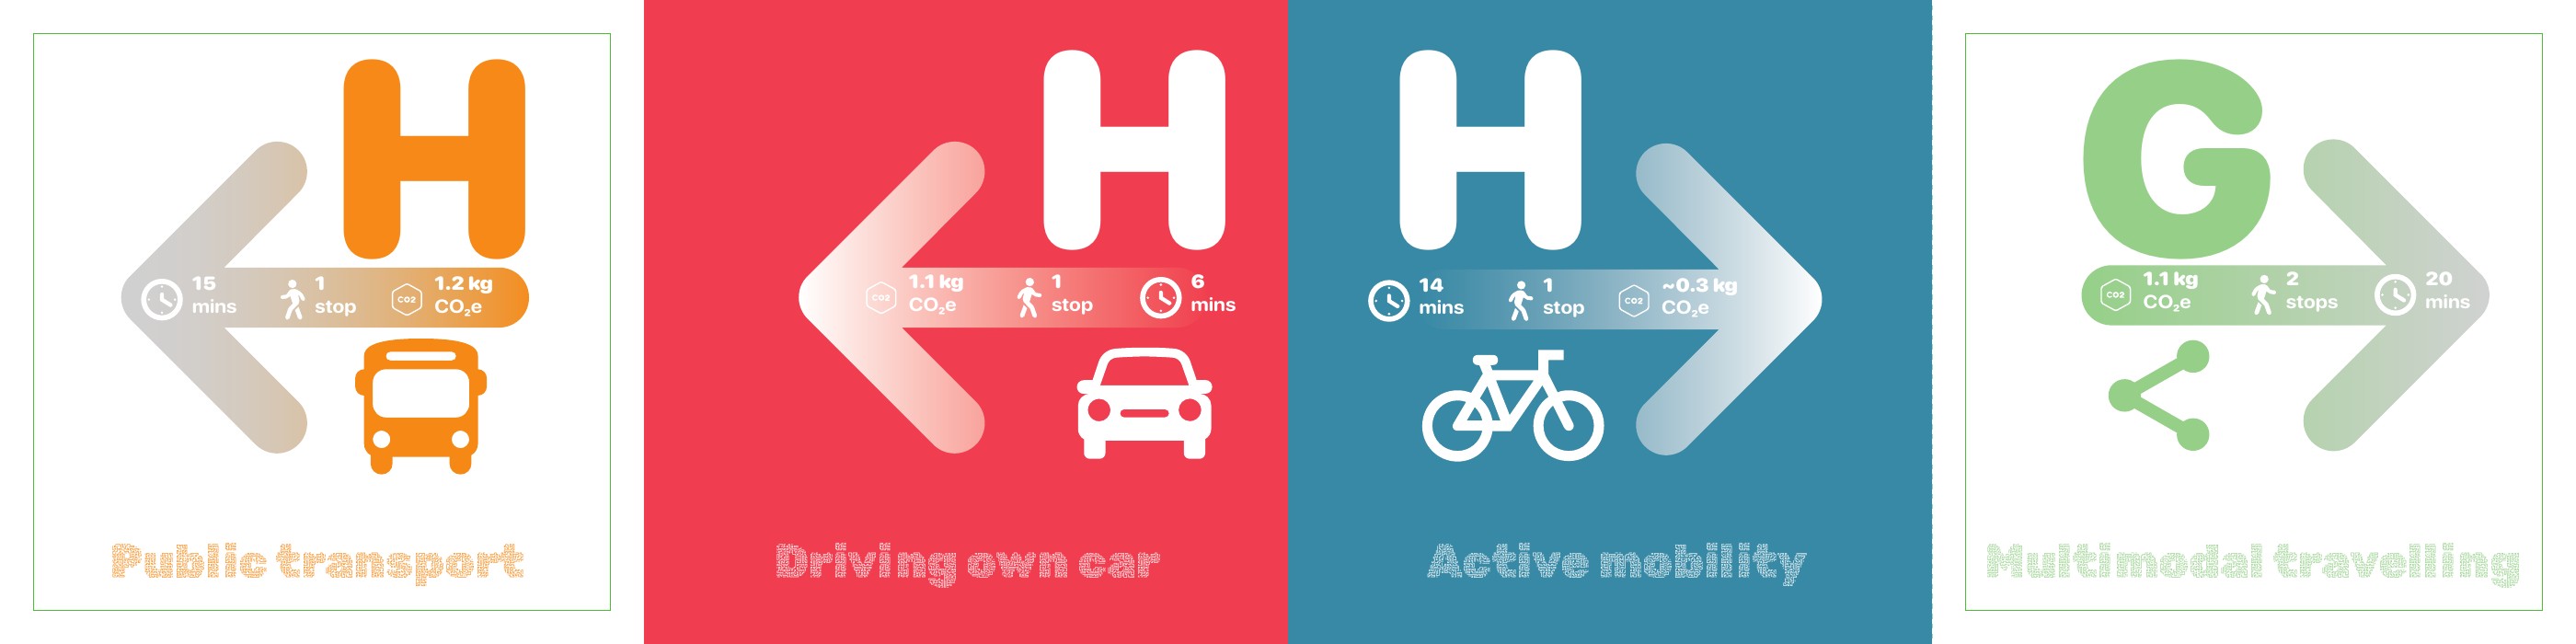
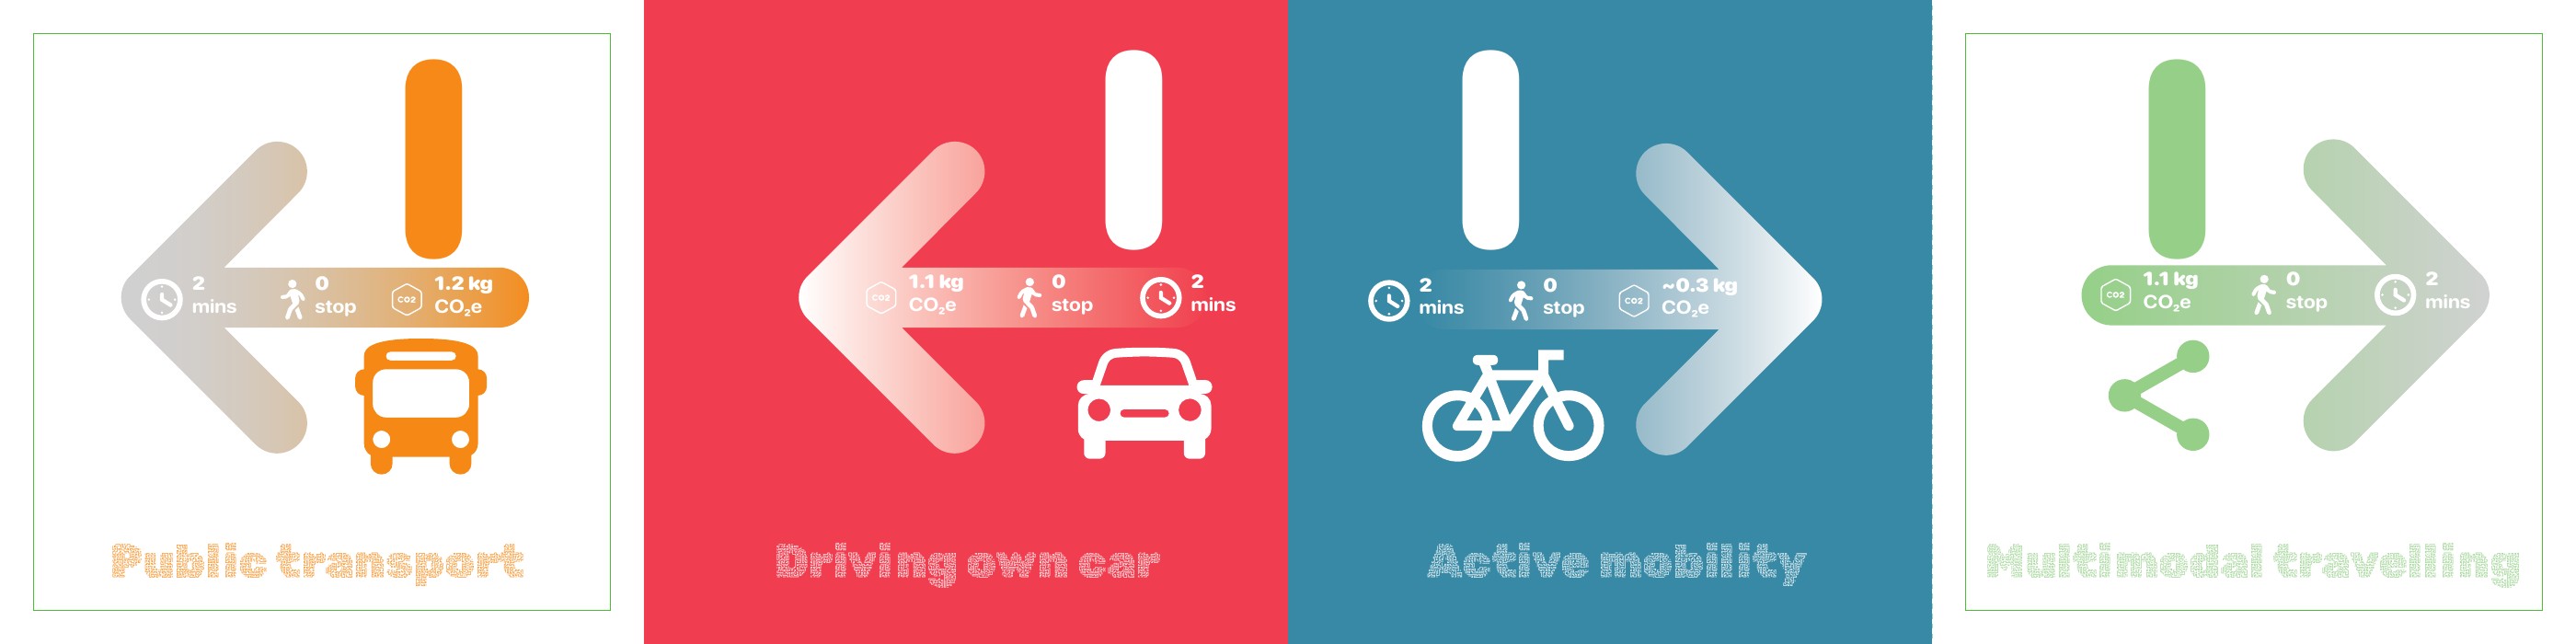
The opening signpost frames mobility as a choice between time, active movement, carbon and reward-not a single fastest route.
- Four travel modes
- Time + carbon
- Wayfinding
Orient visitors to the four mobility modes and establish the visual language used throughout the exhibition.
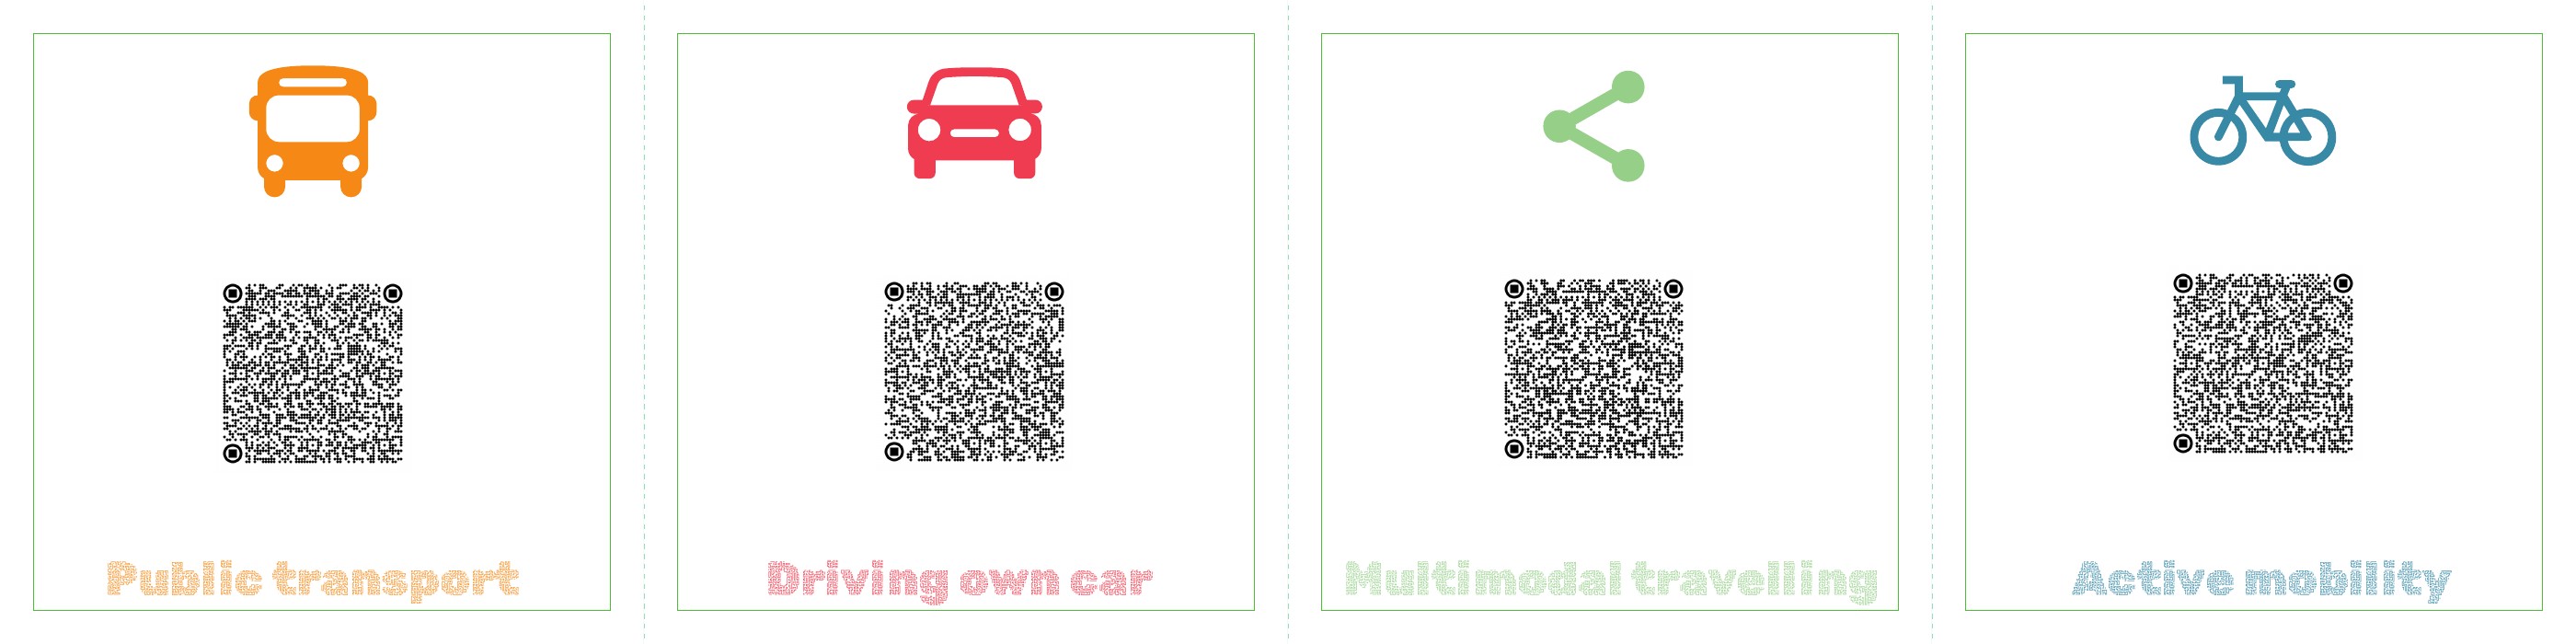
Compare driving, public transport, active mobility and a multimodal trip before selecting a direction.
Introduces the information layer that feeds planning, carbon feedback and reward calculations across the service.
Make trade-offs visible
Rewards
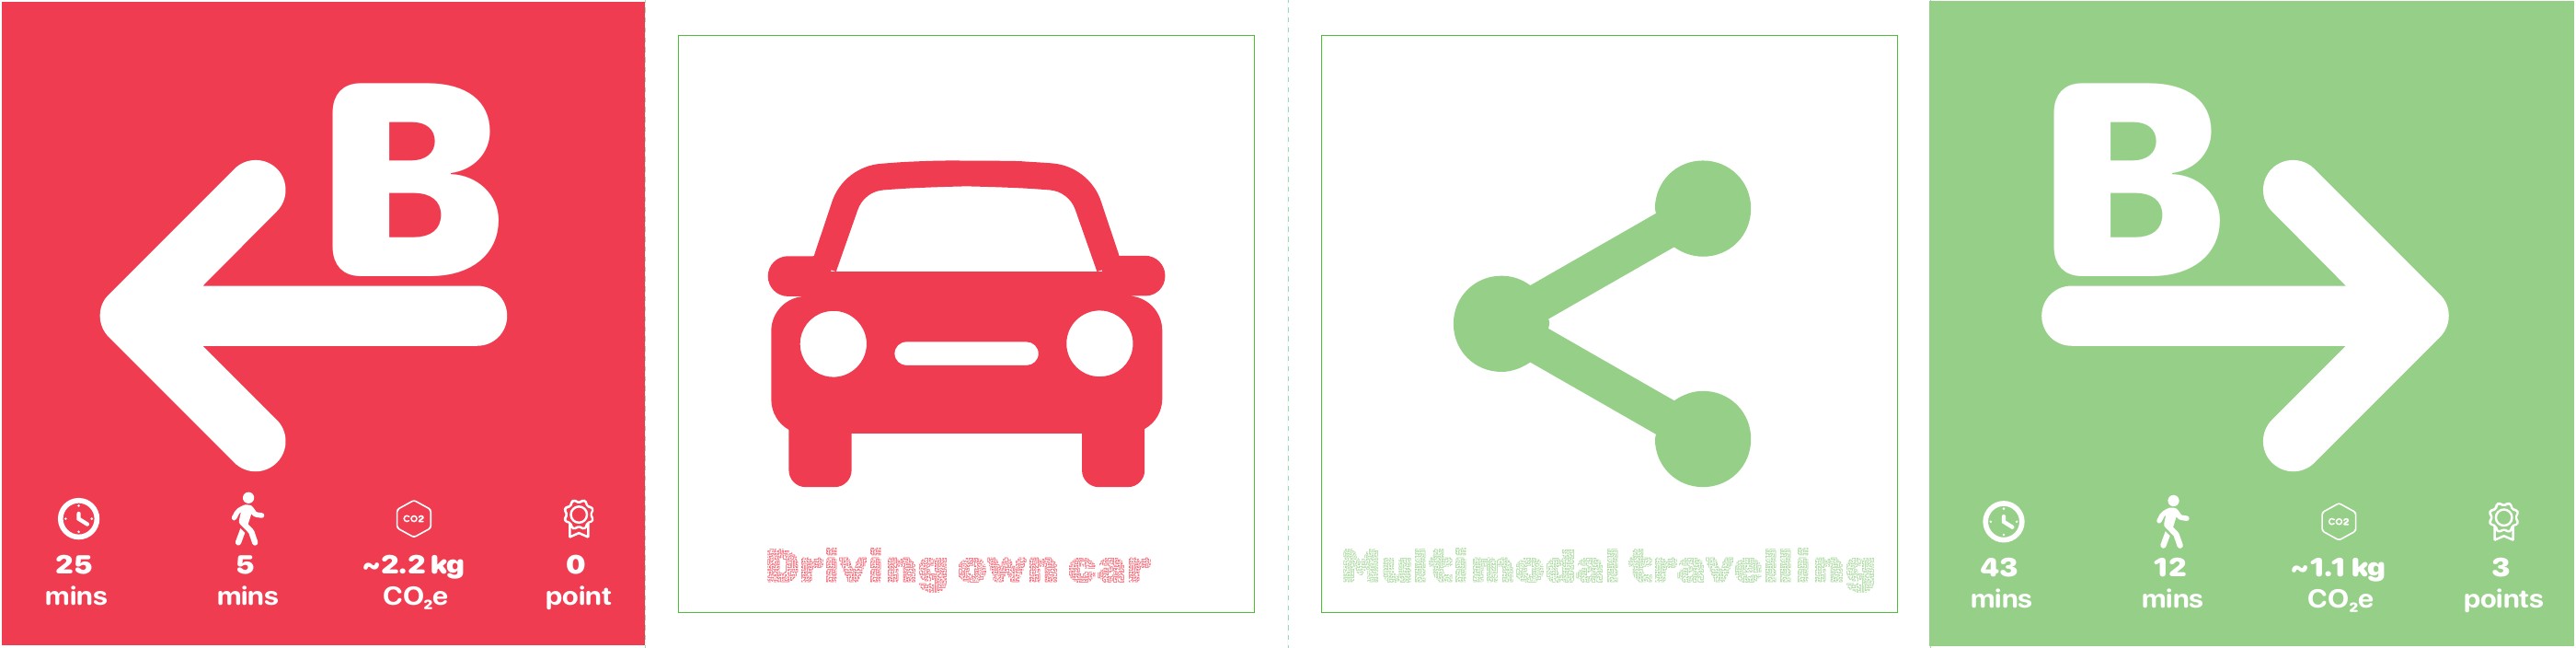
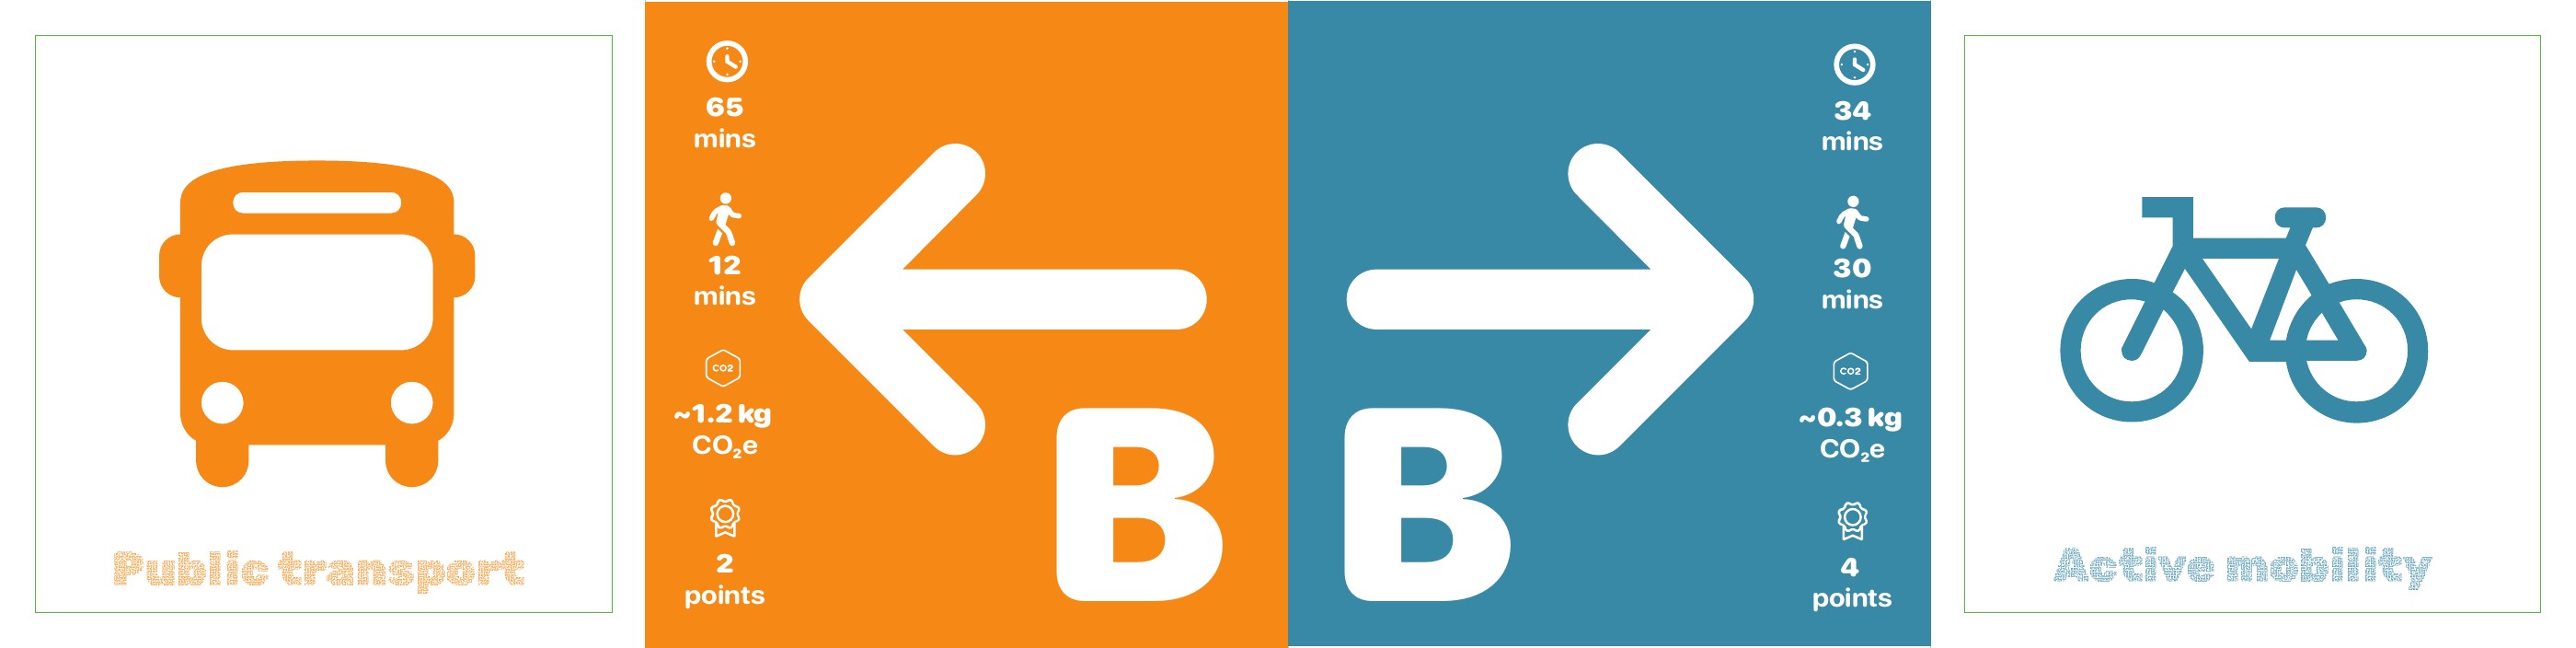
A shared comparison system turns lower-carbon movement into immediate, legible value through points, active minutes and emissions.
- 0-4 reward points
- Mode comparison
- Carbon feedback
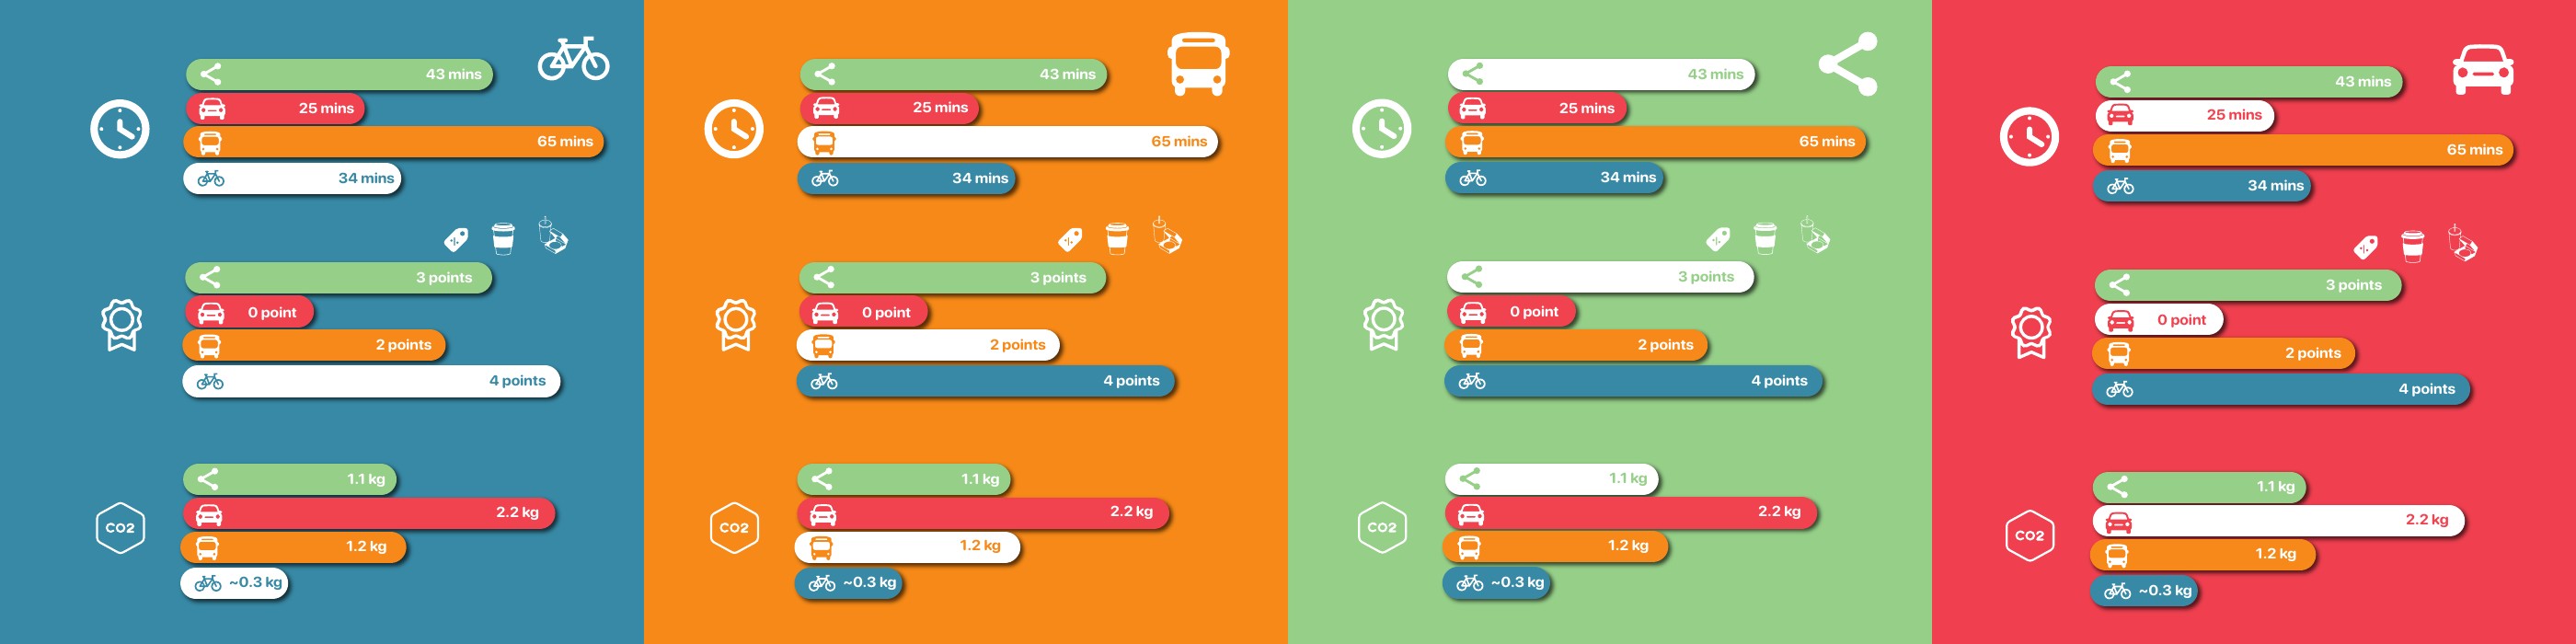
Make the consequences of each travel choice visible at a glance rather than leaving sustainability as an abstract promise.
Read the same four journeys through time, walking, carbon and points, then follow the route toward the preferred option.
Reward values travel with the user into payment, trip review and the final impact signpost.
Challenge the default
Driving & Parking
Real-time parking data meets a behavioural prompt: driving remains available, but its carbon cost and social alternatives become harder to ignore.
- Live parking
- Carpool matching
- Reserved bays
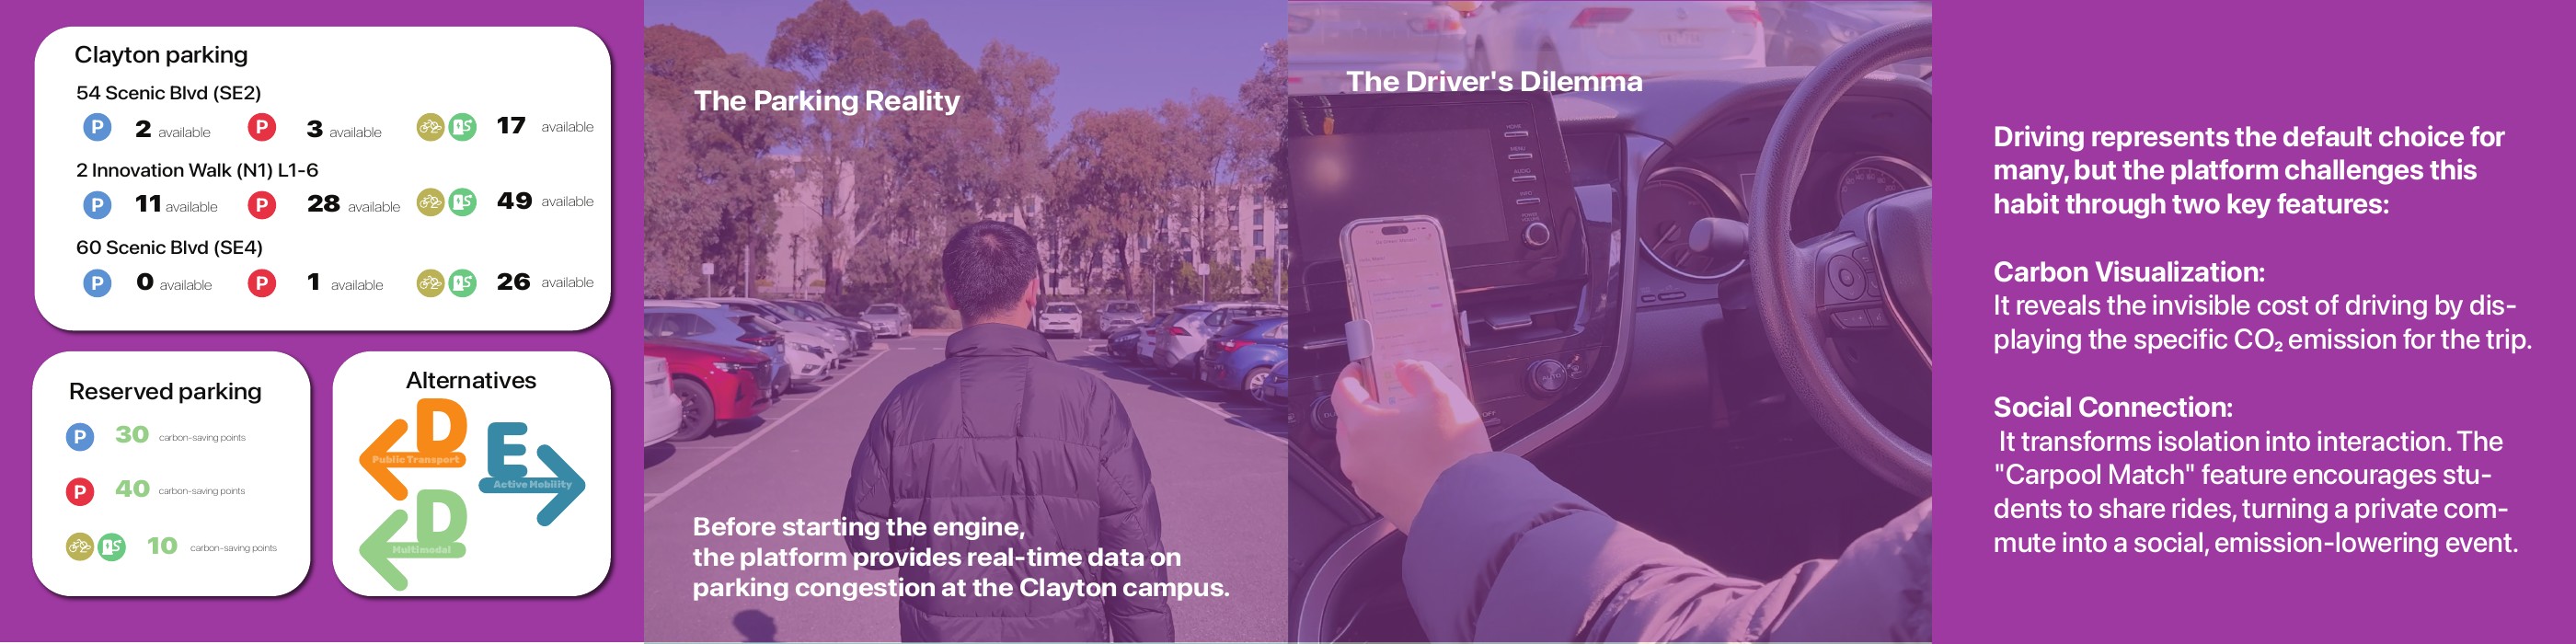
Meet drivers at a familiar decision point and reveal both parking pressure and the environmental cost of the trip.
Check live availability, compare reserved-parking rewards and consider public transport, active travel or carpool matching.
Links parking data to carbon visualisation, social connection and alternative-mode recommendations.
Reduce waiting uncertainty
Public Transit Loop
Live departures and first/last-mile guidance turn the bus loop into a connected commute rather than a sequence of uncertain handovers.
- Routes 601 + 630
- Campus shuttle
- Live departures
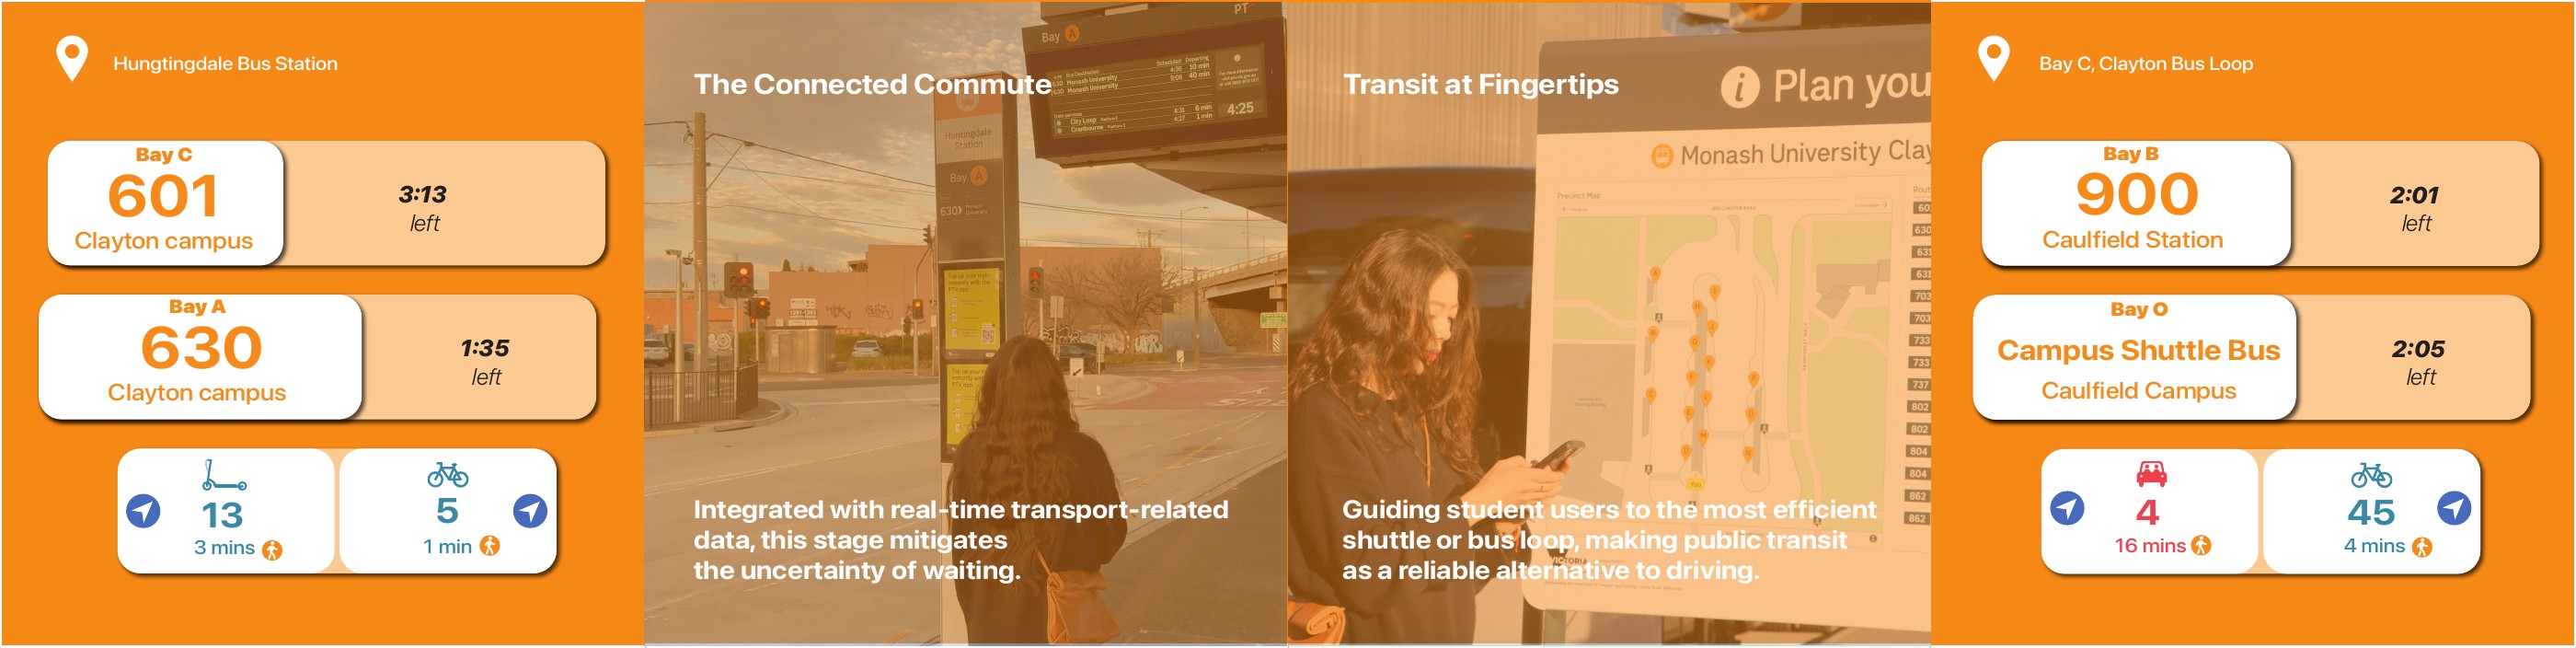
Position public transit as a dependable system by connecting Huntingdale Station, the Clayton bus loop and campus services.
Read live routes and departure times, then choose the most efficient scooter, bicycle or walking connection.
Combines transit feeds, campus shuttle information and micro-mobility guidance in one service layer.
Tailor the ride
Active Mobility Hub
Cycling and micro-mobility become configurable services, with routes tuned for speed, quietness or balance and infrastructure visible before departure.
- Route preferences
- Shared e-bikes
- Bike parking
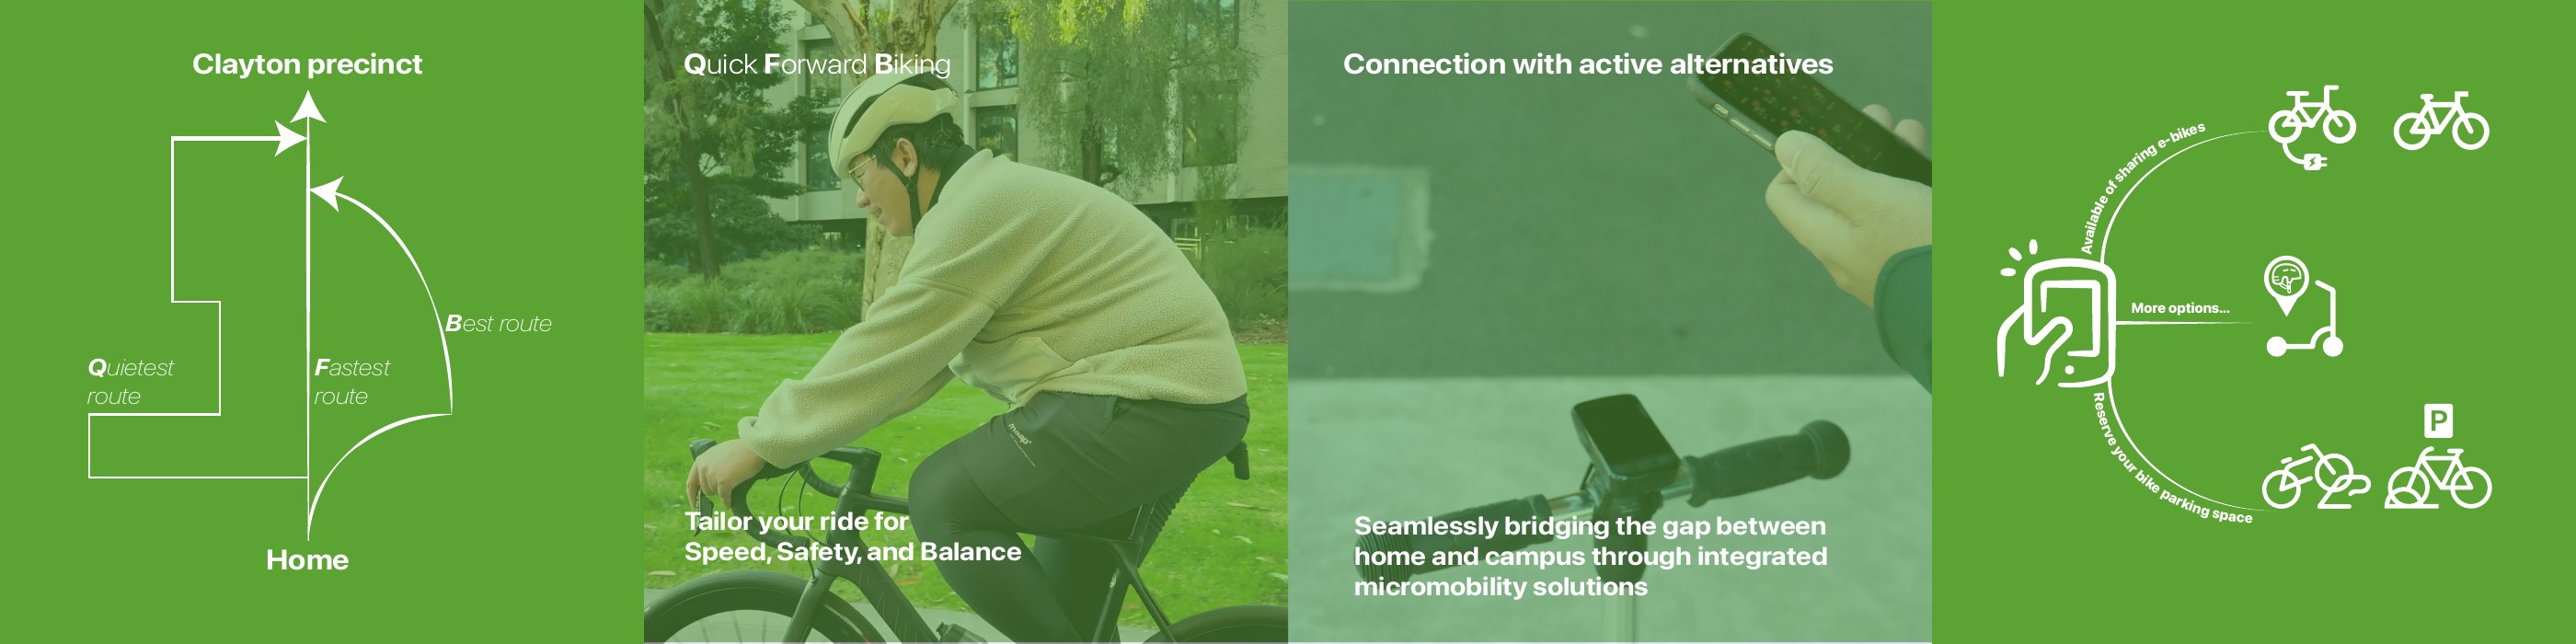
Show active mobility as a practical, supported connection between home, transit and campus-not an isolated mode.
Choose a route preference, find shared e-bikes and reserve an appropriate bicycle parking space.
Bridges route planning, shared vehicles, parking infrastructure and the cycling arrival station.
Make access flexible
Payment
Subscriptions and multi-payment options package the precinct’s transport services around different commuting rhythms and budgets.
- $25-$75 plans
- M-Pass
- Reward redemption
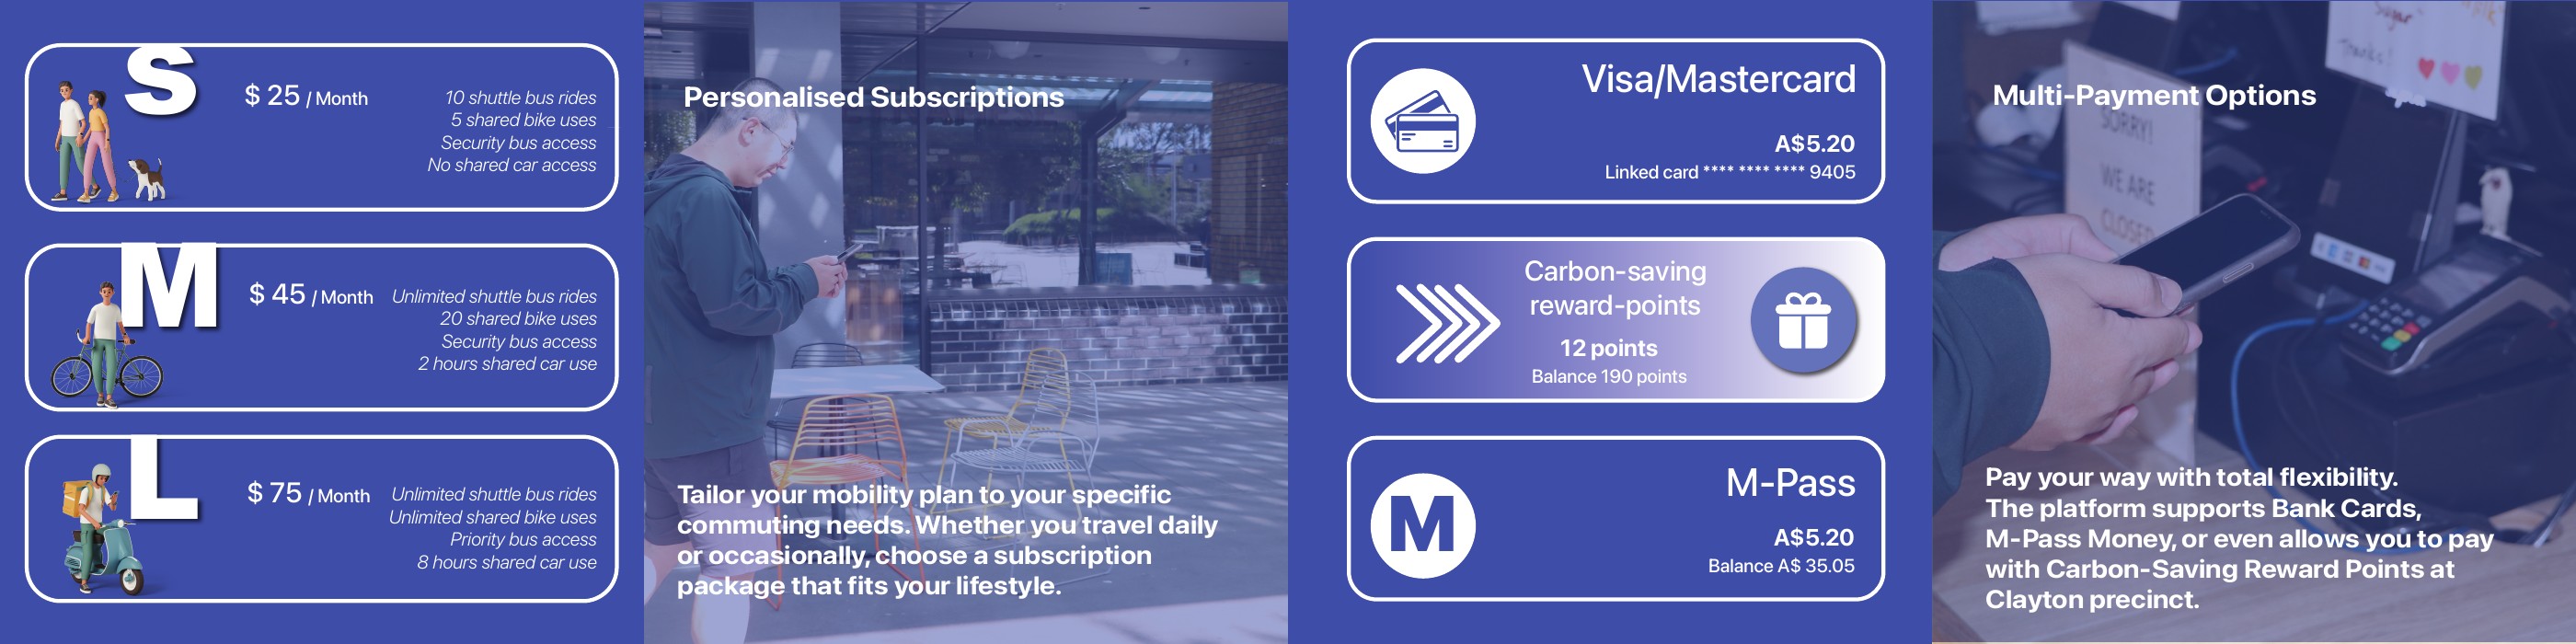
Translate a complex network of services into understandable plans for occasional, regular and intensive travel.
Compare S, M and L subscriptions, then pay by bank card, M-Pass balance or carbon-saving reward points.
Unifies shuttle buses, shared bicycles, security services, shared cars and reward redemption.
Support the arrival
Cycling
The cycling station makes end-of-trip facilities, route conditions and social support visible at the point they matter.
- 47 bike spaces
- 12 lockers
- Route safety
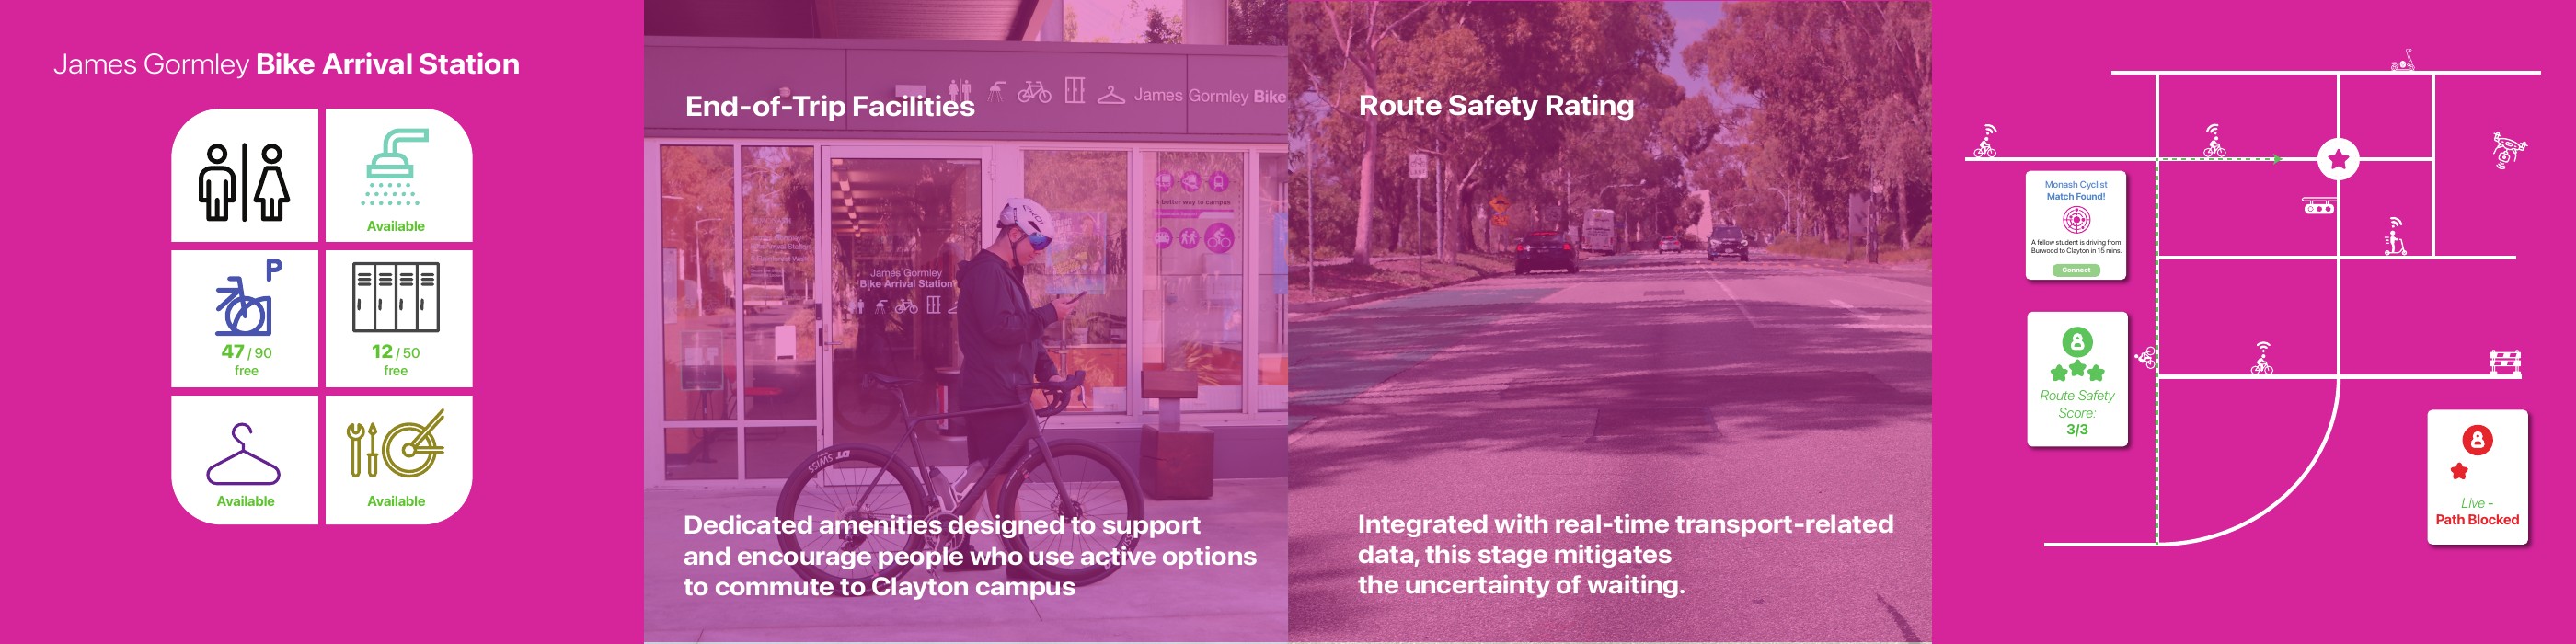
Demonstrate that active travel depends on infrastructure, confidence and community-not route calculation alone.
Check bicycle parking and locker capacity, review route safety and connect with another Monash cyclist.
Combines James Gormley Bike Arrival Station, live path reporting and peer-to-peer connection.
Find the right campus port
Arriving
Arrival becomes an active navigation moment, guiding travellers toward the campus entry point and facility that best fits their mode.
- Campus ports
- Interactive map
- Car-free zone
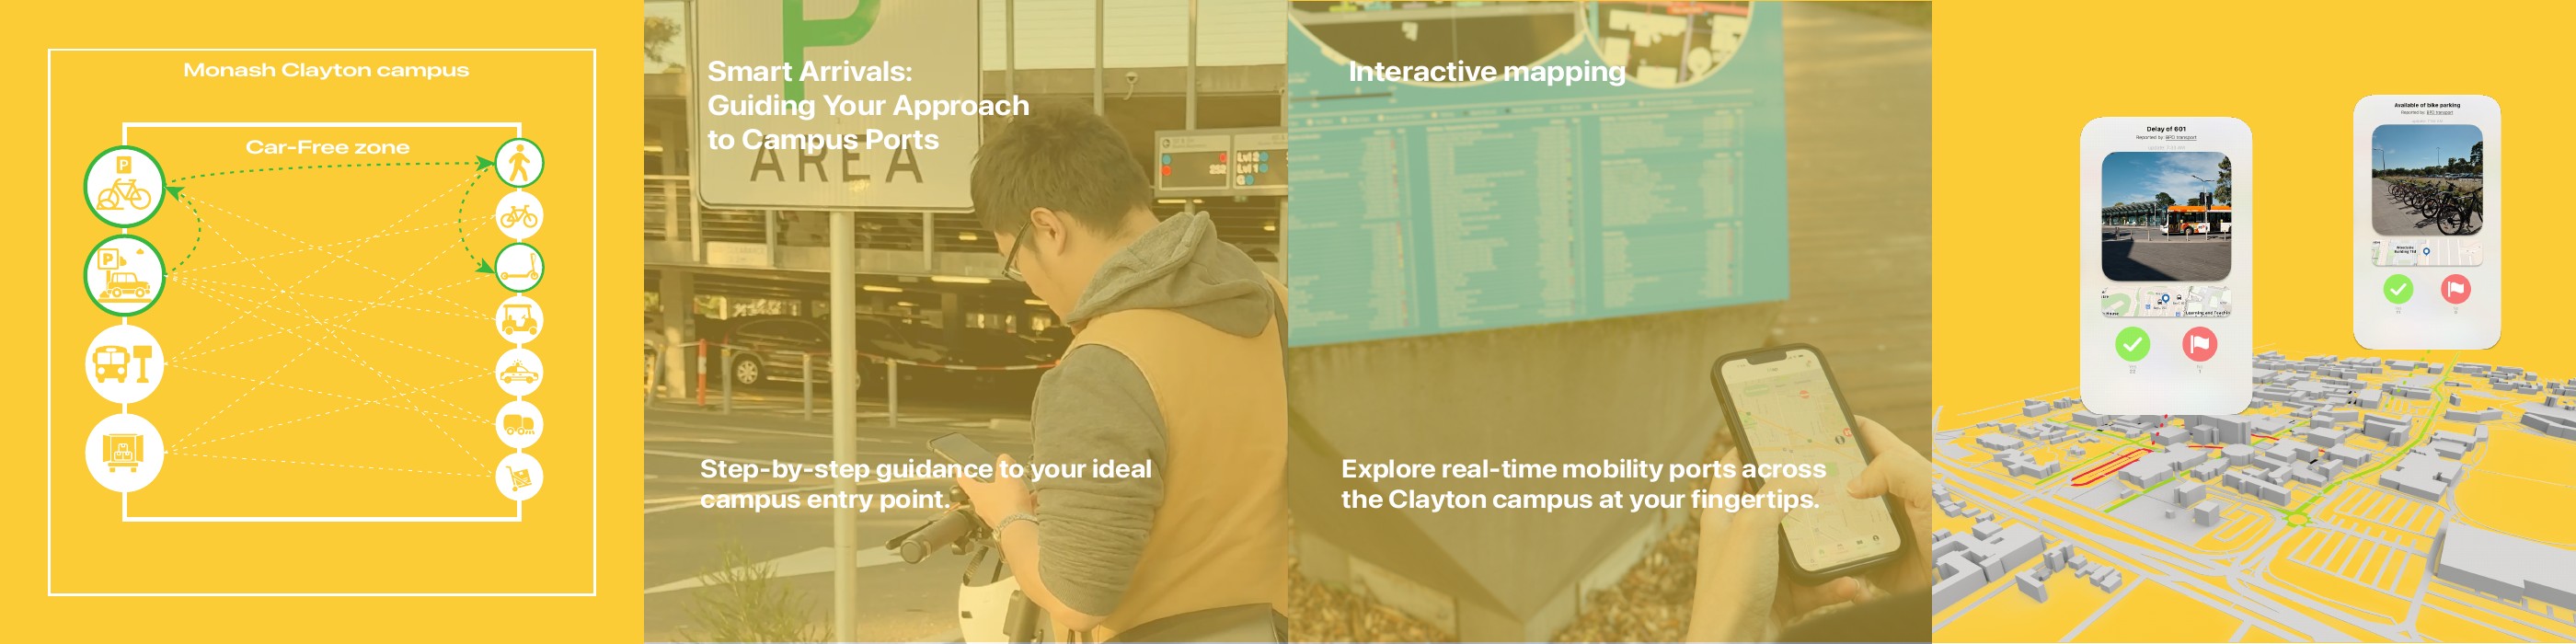
Reduce the final uncertainty between reaching the precinct and arriving confidently at a destination.
Follow step-by-step guidance and explore a live map of mobility ports across the car-free campus core.
Links campus wayfinding, parking, end-of-trip facilities and last-mile transport services.
Close the feedback loop
Impact
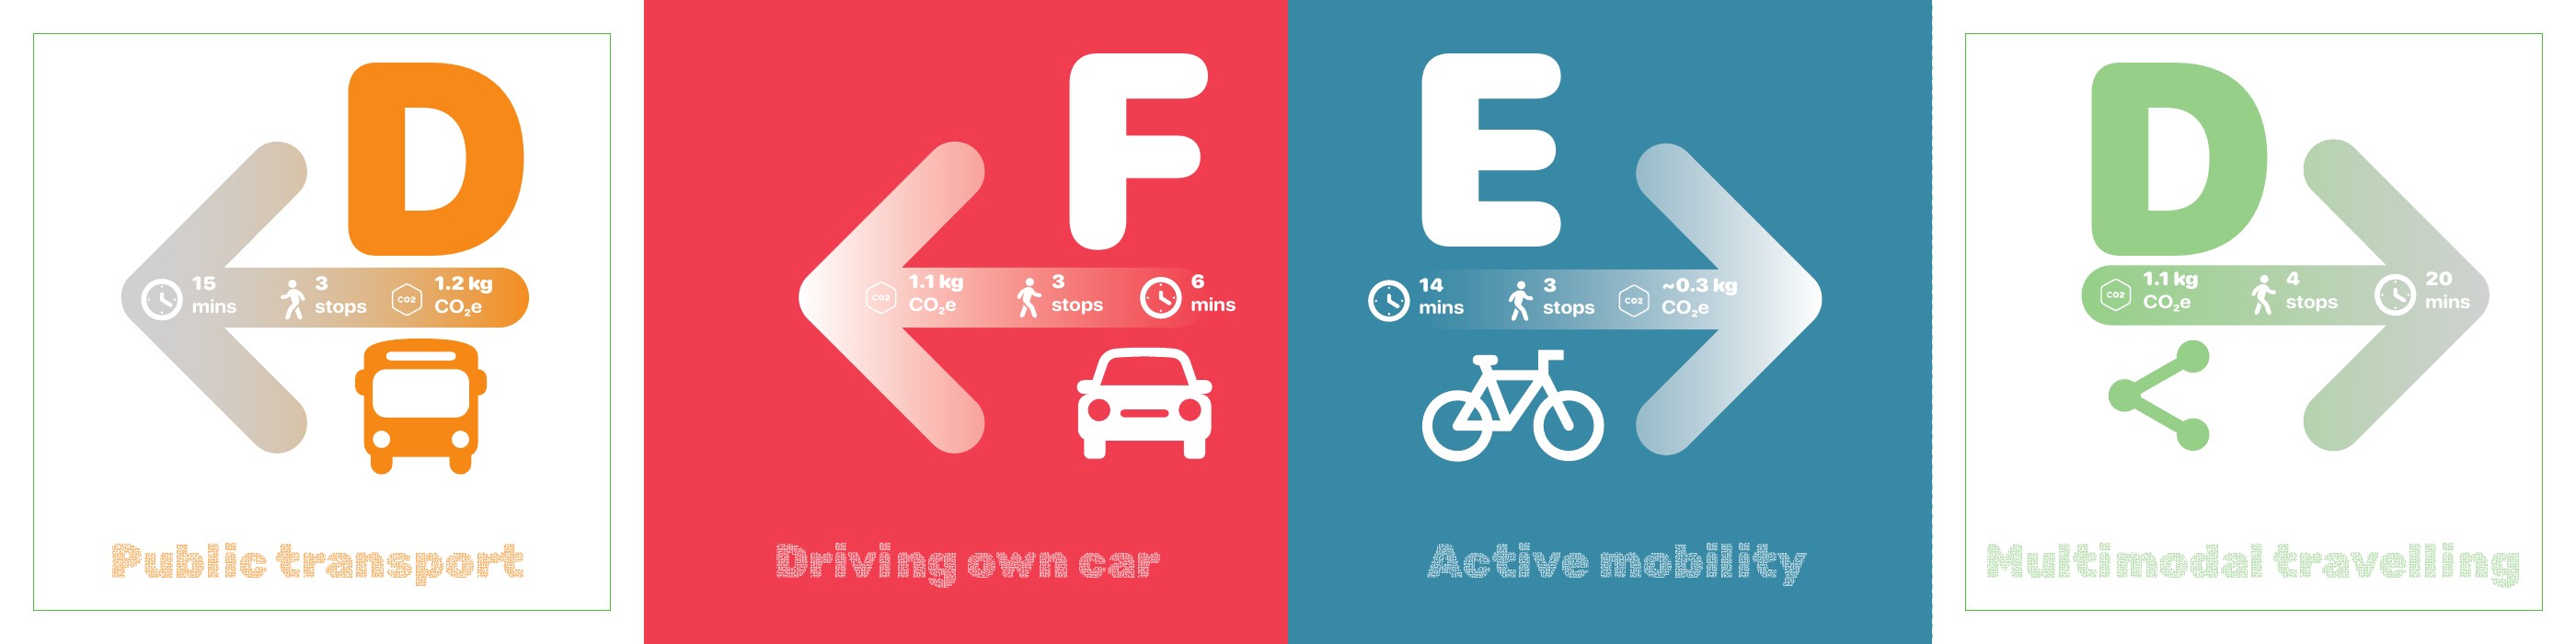
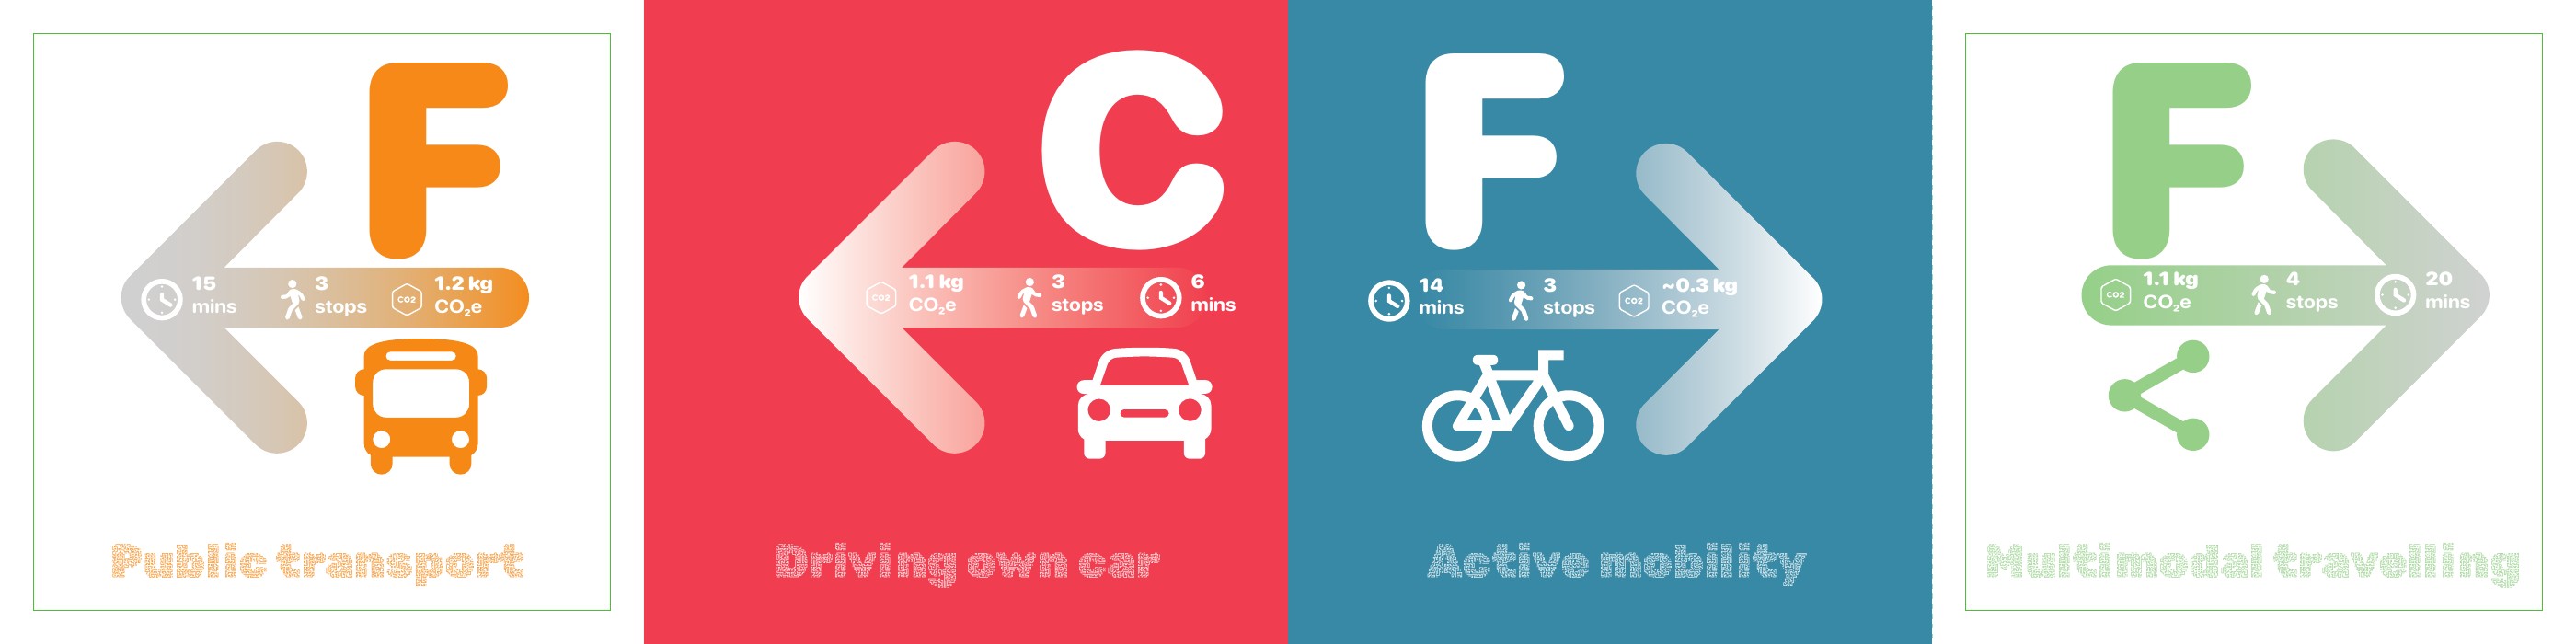
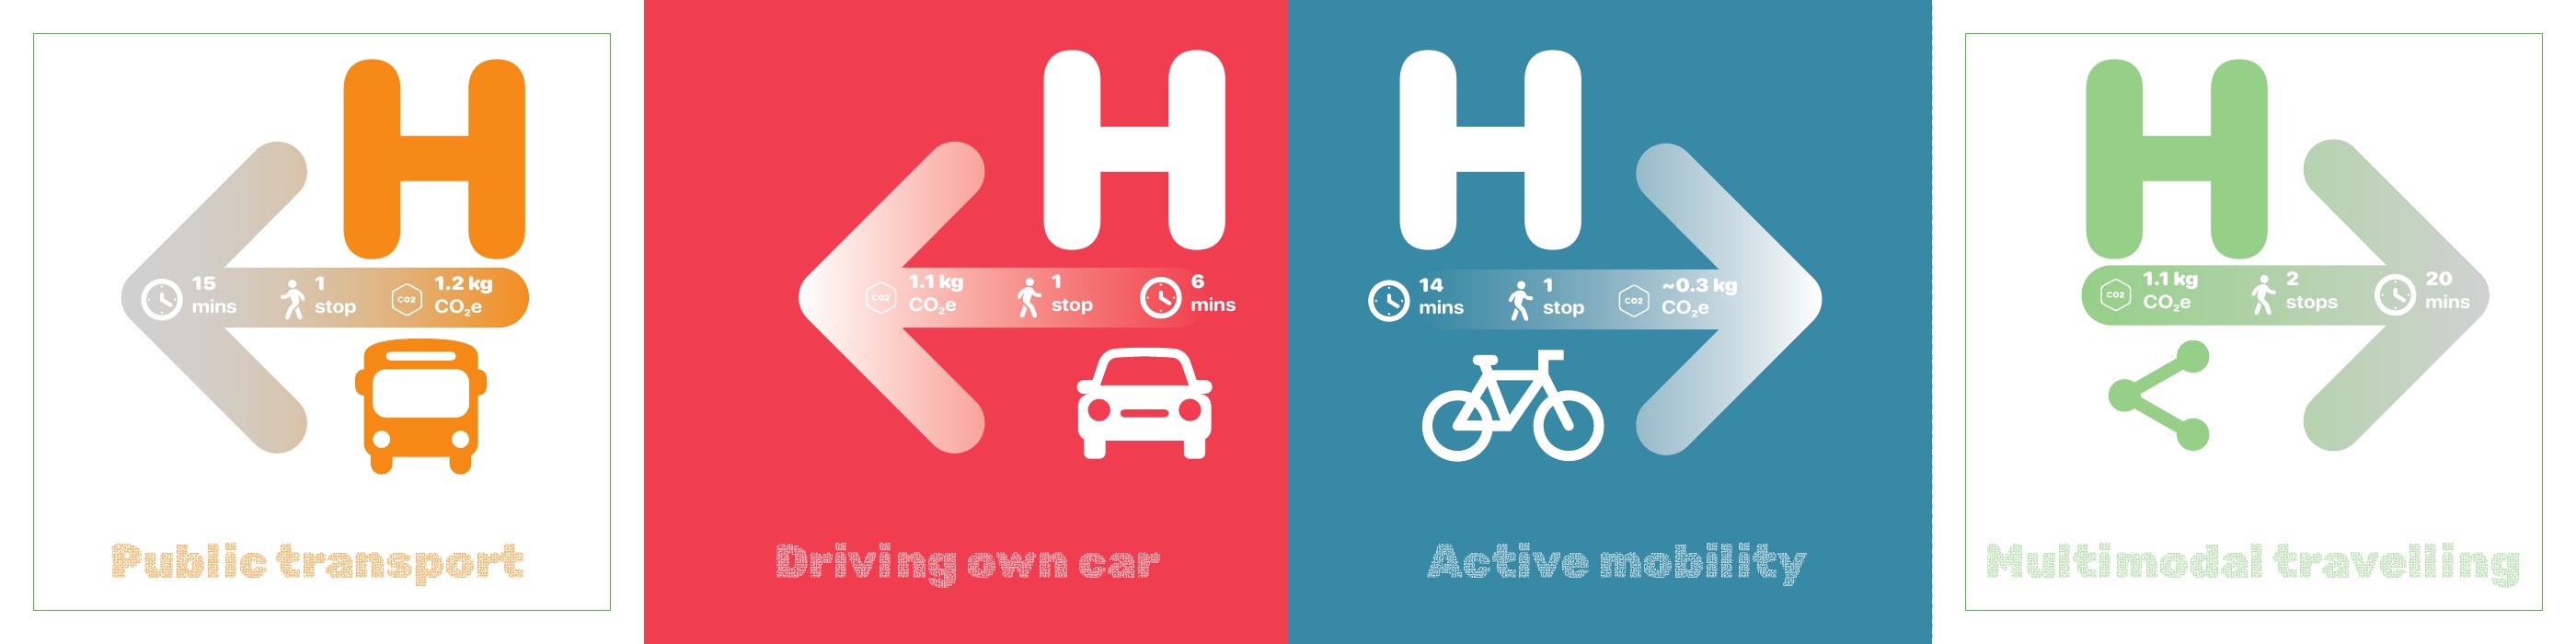
The final signpost returns the journey to the traveller, showing how time, active movement, emissions and rewards changed with the chosen mode.
- Trip review
- Active minutes
- CO₂e + rewards
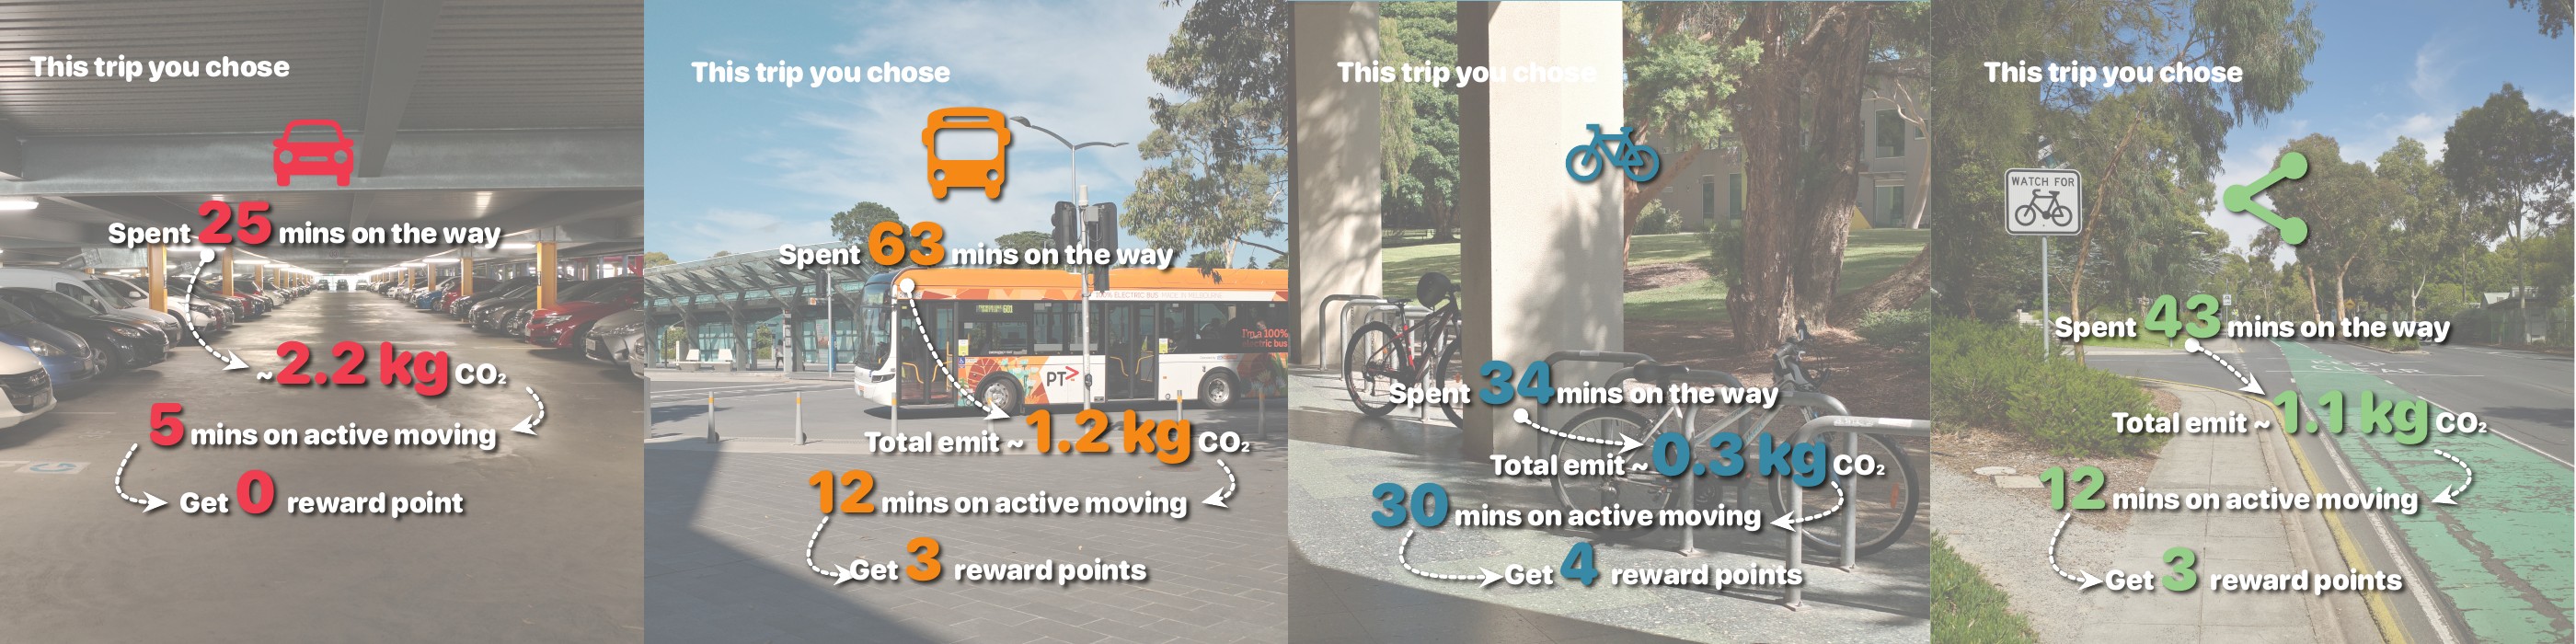
Turn a completed trip into a moment of reflection and make personal sustainability progress concrete.
Compare four completed journeys: driving, public transport, active mobility and multimodal travel.
Feeds trip outcomes back into the information hub, reward balance and future route recommendations.